Technical analysis is the forecasting of market prices by means of analysis of data generated by the process of trading. Technical analysis relies on the assumption that markets discount everything except information generated by market action, ergo, all you need is data generated by market action. Let's join and discuss the technical analysis in depth on particular stock with the traders all over the world.

Tuesday 23 August 2011

SBC CORPORATION BERHAD

Company Name
:
SBC CORPORATION BERHAD
Stock Name
:
SBCCORP
Date Announced
:
09/08/2011


Type
:
Announcement
Subject
:
OTHERS

Description
:
SBC CORPORATION BERHAD ("SBC" OR "THE COMPANY")
PROPOSED RENEWAL OF THE AUTHORITY FOR THE COMPANY TO UNDERTAKE A SHARE BUY-BACK OF UP TO 10% OF ITS ISSUED AND PAID-UP SHARE CAPITAL

Announcement Details/Table Section :


At the Twentieth Annual General Meeting (“AGM”) of SBC held on 20 September 2010, the Board of Directors of SBC (“Board”) obtained a mandate from shareholders to undertake a share buy-back of up to 10% of the issued and paid up share capital of SBC (“Share Buy-Back”). The authority obtained by the Board for the Share Buy-Back shall lapse at the conclusion of the forthcoming Twenty-first AGM unless a renewal of the mandate for the Share Buy-Back is obtained from the shareholders of SBC.
The Board wishes to announce that the Company proposes to undertake a renewal of the authority for the Company to undertake a share buy-back of up to 10% of its issued and paid-up share capital ("Proposed Share Buy-Back Renewal") at the forthcoming Twenty-first AGM of the Company.

Details of the Proposed Share Buy-Back Renewal will be set out in the Statement to the shareholders of the Company, which will be sent together with the Notice of Twenty-first AGM.

This announcement is dated 9 August 2011.

Monday 22 August 2011

Mah Sing gets sales, bookings of RM190.6m

Property developer Mah Sing Bhd has recorded sales and bookings worth RM190.6 million with the launch of a commercial project and previews of two residential projects over the weekend.

In a statement today, Mah Sing Group Managing Director/Chief Executive Officer Tan Sri Leong Hoy Kum said all 78 units of retail lots in Star Avenue@Damansara, Sungai Buloh, valued at RM71.7 million had been snapped up.

The company also recorded a strong take up of close to 75 per cent of the Kinrara Residence luxury bungalows and semi-detached homes in Puchong. - Bernama

Sunday 21 August 2011

SBCCORP bullish

Base on insider news, SBCCORP potentially go to RM1.50 before Hari Raya.  Lets analyse from TA perspective.
Trend: Form higher low, uptrend (Bullish)
ADX: Bullish crossover bearish with momentum (Bulish)
MACD: Bull nearly kissing bear form below (Undetermine)
RSI: Cross above 30% from below indicating buy strength is back (Bullish)
STO: Touching 50% (Bullish)
Volume distribution: Strong buying force (Bullish)
Conclusion: 5 Bulls 1 Neutral
Entry price: 1.02
TP: 1.13, should we wait till 1.50?
Cut loss: 0.98

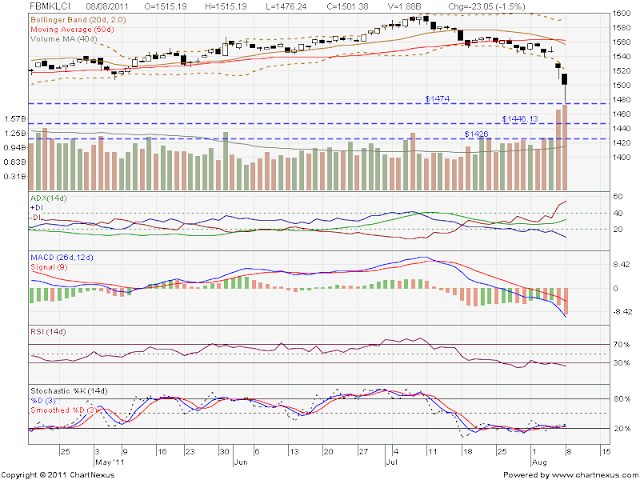
KLCI finding support at 1473

1473 is a critical support, break below, it form lower low and potential to dive further down.  All indicators show that the KLCI is bearish.  Stay sideline or cash out from stock market.  I'll closely monitor the trend, if it break above 1510, there could be a slight hope for KLCI to continue bullish.

Friday 12 August 2011

AirAsia in UK tie-up talks


AirAsia Bhd, the region’s biggest listed budget carrier, will discuss a potential joint venture in London, Chief Executive Officer Tony Fernandes said.

“Closing off a new potential joint venture to submit to the board for AirAsia,” he wrote on his personal Twitter site. “Sales are kick ass,” said Fernandes, adding that he was en route to the U.K.

The Sepang, Malaysia-based airline flies to London through its long-haul arm AirAsia X Sdn Bhd. -- Bloomberg

Read more: AirAsia in UK tie-up talks http://www.btimes.com.my/Current_News/BTIMES/articles/20110812121453/Article/index_html#ixzz1UpV2eX3X

Wednesday 10 August 2011

KLCI Plunge again?

Bingo! KLCI fail testing the resistance at 1497 and manage to find its support at 1473 and close at 1480.  Will tomorrow KLCI break support at 1442 &1428? Superb mega sale...

Stock to punt

Wow, Dow plunge 3% -450 at 11:10pm.  Perhaps, tomorrow KLCI will gap down open.  Good chance to punt again? Forth round Mega sales?  My watch list for tomorrow:
Mahsing- Hope drop below 2.14, then shall i consider Mahsing-cb @ 0.175?
MBSB- Punt MBSB-CA (@0.08?) if mummy below 1.50
MRCB- if below 2, punt MRCB-CE@ 0.07?

*Good luck to me*


Wall Street slumps on worries over French banks

By Edward Krudy
NEW YORK (Reuters) - Wall Street stocks fell sharply on Wednesday on fears over possible trouble in the French banking sector that has large exposure to shaky peripheral European debt.
U.S. financial stocks led the decline as the KBW bank index slid 6.2 percent. Large financial institutions fell sharply, with Bank of America Corp down 12.2 percent to $6.93.
French banks were hit hard in Paris trading. Societe General, where U.S. traders have focused their attention, fell 16 percent. BNP Paribas fell 13.2 percent.
"France owns $350 billion worth of Italy's debt on their banks' books," Dave Rovelli managing director of U.S. equity trading at Canaccord Adams, who said fears of a failure in the sector were hitting U.S. markets.
The Dow Jones industrial average dropped 342.96 points, or 3.05 percent, to 10,896.81. The Standard & Poor's 500 Index fell 33.66 points, or 2.87 percent, to 1,138.87. The Nasdaq Composite Index shed 72.56 points, or 2.92 percent, to 2,409.96.
Indexes gave up much of Tuesday's snap-back rally. The S&P 500 is down nearly 18 percent since a peak at the start of May. Worries about the U.S. economy and high levels of public debt in Europe have sent stock cascading over the last two weeks.
(Reporting by Edward Krudy; editing by Jeffrey Benkoe)


Tuesday 9 August 2011

FBMKLCI

Blue lines are resistance and red lines are support.  Perhaps KLCI will gap up tomorrow since DJ is up 2.05% now.

Altera Corp

Trend: Downtrend (Bearish)
CandleStick: Inverted hammer indicate that the stock will go sideway or go up (bullish)
ADX: Downtrend with strong momentum (Bearish)
MACD: Downtrend (Bearish)
RSI: Below 30% (Bearish)
STO: Below 20% (Bearish)
Conclusion: 1 Bull 5 Bears

What price to sell?
Blue lines are resistance level and red lines are support level.  $36 is strong resistance for ALTR Corp, if break above $36, the next resistance level is $38.29.  Whereas, its support at $34.33.  You may either wait to sell at $36 or higher, but if the stock direction not in your favor, you may consider to sell at $34.33.

Monday 8 August 2011

FBMKLCI

Would like to punt any counters if KLCI rebounce from support.  Perhaps tomorrow another gap down :)

Sunday 7 August 2011

U-TURN (Sell)

Like the UTURN
(BUY) signal in a Bear market, U-TURN (SELL) signal is equally powerful to indicate a
change in trend when a stock is going strong and is making new higher prices (in a Bull
market). All of a sudden in a Bull trend the stock puts up a disappointing down day and
surprises most people. Many people think this as just a Reaction and expect the stock to
resume its continued ascending movement soon; but it does not happen most of the time
when the reversal conditions of the U-TURN (SELL) signal are met.
Here are the conditions for the U-TURN (SELL) signal with Bearish implications in a Bull
market. Please note that the signal discussed here takes place when the stock is in a uptrend
(Bull market) but the signal actually indicates that the stock is about to enter into a Bear
market or a down trend.
Key Points to remember: Current Trend- Up. Strong Open. Strong Bear Day. Increase
in Volume.
Conditions:
1. The stock has to be in a continued Up-trend.
http://www.profitfromprices.com Profit 12 From Prices
2. Today’s HIGH price (TDH) has to be highest price (TOP) for the stock in the last few
days. (If it is the highest for the last three or more weeks, we have a strong form of a
U-TURN (SELL) signal. If it is the highest for the last three to ten trading days only,
we have a weak form of U-TURN (SELL) signal. The strong form indicates a likely
trend reversal for the current major trend; and a weak form is related to just the start
of a Reaction or the end of a Correction.).
3. Today’s Open price (TDO) has to be HIGHER than Previous Day’s High price (PDH).
TDO > PDH (The more the difference between TDO and PDH, the more powerful the
signal is going to be)
4. Today’s Close price (TDC) has to be LOWER than Previous Day’s Close price
(PDC).
TDC < PDC
5. Today’s Close price (TDC) has to be LOWER than Previous Day’s Open price
(PDO).
TDC < PDO
6. Today’s Volume has to be decisively HIGHER than the normal volume of the last few
days or Previous Day’s volume. If the above conditions are fulfilled, you will mostly
see a decisive jump in stock volume today. If you don’t see a jump in the volume
today, the signal loses some of its strength.

U-TURN (Buy)

U-TURN (BUY) is one of my most favorite signals. As mentioned earlier, the (BUY) version of
U-TURN takes place when a stock is in a down-trend and is likely to enter into an up-trend. It
signals possibilities about the start of an up-trend.
Assume a stock is going down for quite some time. The following are quotes for the latest two
days:
Today 22, 27, 21, 26
Yesterday (Previous Day) 25, 26, 23, 24
Yesterday, the stock opened at 25$, touched a high of 26$ and a new recent low of 23$, and
at the end of the day it closed at 24$. Now today, when market opens, this stock opened at
22$ (a price lower than the Previous Day’s Low price of 23$) and started going down. Now
when it is trading as low as 21$, there are signs of fresh buying which pushes the price
higher. Not a big thing so far because this kind of buying could be seen several times during
any trading session. However, when the stock manages to trade higher than today’s Open
price or 22$, we need to be vigilant for a likely trend reversal. Now if the stock keeps going up
and closes for today at say 26$, which is higher than both Previous Day’s Open price of 25$
and the Previous Day’s Close price of 24$, we have a trend reversal signal! The stock that
has been going down for the last few days and also during the first few hours today,
somehow closed with a happy ending and a strong Close price. This reflects a 180-degree
change in the sentiment. Hence we will call this signal a U-TURN (Buy) signal.
What makes U TURN a powerful Trend Reversal signal? As we know, when a stock is in a
downtrend, sellers out-number or out-power buyers. In such circumstances, it is normal for
the stock to keep making lower Low prices as time passes. This reflects bearish, negative
sentiment or outlook for this stock. Now when trading starts for today, this stock opens at a
price lower than Previous Day’s Low price. This is common for any stock that is going down
and it just indicates the continuation of the negative sentiment. Now if at some point in time
during the session, the stock stages a reversal and starts trading higher. This is likely due to
an emergence of fresh demand at current low price of the stock. Now how can we determine
that the stock is really staging a reversal? To answer this question, the following tests can
help us differentiate a strong reversal from a temporary emergence of buying. First, there has
to be a noticeable increase in volume since this turning point. Second, it has to keep going up
and cross Previous Day’s Open and also the Close price. If both these conditions are fulfilled,
we can be sure that the buying in the stock has been real and powerful. To take advantage of
the currently low stock price, some players seem to have started buying it decisively despite
the strong negative sentiment held by most other players. This buying must be significant
because it not only absorbed what most players had to sell/offer, but buyers kept asking for
more stocks even at higher prices. Today’s demand not only absorbed the selling pressure,
but it even pushed the price higher than the prices of the Previous Day! Isn’t this a
convincing reversal in stock prices?
http://www.profitfromprices.com Profit 8 From Prices
This is a complete U-TURN in the stock price trend and now with a Stop-loss at Today’s Low
price, one can start taking long positions.
Key Points to remember: Current Trend- Down. Weak Open. Strong Bull Day.
Increase in Volume.
Conditions:
1. The stock has to be in a continued downtrend.
2. Today’s Low price (TDL) has to be the LOWEST price for the stock over the last few
days. (If it is the lowest for the last few weeks, we are likely to have a strong major
trend reversal signal- a strong form of U-TURN. However if Previous Day’s Low price
is the lowest for only the last three to ten days, we have a signal that is more likely to
mark the beginning of a Correction or the end of a Reaction – a weak form of UTURN).
3. WEAK OPEN: Today’s Open price (TDO) has to be LOWER than Previous Day’s
Low price (PDL).
TDO < PDL (The more the difference between TDO and PDL, the more powerful the
signal is going to be)
4. Today’s Close price (TDC) has to be HIGHER than Previous Day’s Close price
(PDC).
TDC > PDC
5. Today’s Close price (TDC) has to be HIGHER than Previous Day’s Open price
(PDO).
TDC > PDO
6. Today’s Volume has to be decisively HIGHER than the normal volume over the last
few days or Previous Day’s volume. If you don’t see a jump in the volume today, the
signal loses some of its strength.

Thursday 4 August 2011

XOX will continue bull?

Trend: Uptrend (Bull)
ADX: Bull crossover bear with strong momentum (Bull)
MACD: Uptrend (bull)
RSI: Cross above 50% from below (Bull)
STO: Bull crossover bear with signal line above 80% (bull)
Volume distribution: Strong buy force(Bull)
Conclusion: 6 bulls
Entry: 0.37
TP: 0.435
Cut loss: 0.35

Wednesday 3 August 2011

Mahsing

Trend: Form higher low, waiting to form higher high (Neutral)
ADX: Downtrend (Bearish)
MACD: Bullish crossover bearish (Bullish)
RSI: Moving upward (bullish)
STO: Uptrend (bullish)
Volume distribution: Strong sell force (bearish)
Conclusion: 3 Bull 2 bear 1 neutral
Entry Price: 2.53
TP: 2.55, 2.63, 2.68
Cut Loss: 2.4

LIONIND

Trend: Undetermine (Neutral)
ADX: Uptrend with weak momentum (bearish)
MACD: Waiting bullish to crossover bearish (Neutral)
RSI: Moving upward (Bullish)
STO: Uptrend with signal line touching 80% (Bullish)
Volume distribution: Strong buy force (Bullish)
Conclusion: 3 Bull 1 bear 2 neutral
Entry price: 1.84
TP: 1.89, 1.95
Cut loss: 1.72

KBB

Trend: Descending triangle (Bearish)
ADX: Flat (Neutral)
MACD: Downtrend (Bearish)
RSI: Below 50% (Bearish)
STO: Uptrend (Bullish)
Volume Distribution: Sell force dominant (Bearish)
Conclusion: 1 bull 4 bear 1 neutral
Entry price: 0.49
TP: 0.51
Cut Loss: 0.43
*Low reward to risk.

Infotec

Trend: Uptrend (Bullish)
ADX: Uptrend with momentum (Bullish)
MACD: Uptrend (Bullish)
RSI: Cross above 70% (Bullish)
STO: Uptrend with signal line above 80% (Bullish)
Volume Distribution: Strong buy force (Bullish)
Conclusion: 6 Bull

Entry price: 0.28
TP: 0.30
Cut loss: 0.26
RR: 1

Monday 1 August 2011

CBIP

Entry price: 4.14
TP: 4.36, 4.47
Support: 4
High buy force.