
Monday, 10 October 2011


Friday, 30 September 2011
KLCI and Dow Jone Industrial


For DJIA, 40 MA is hard resistance.Last few days, it try to break but all attempts fail. Next week, perhaps it will find support at 10728. This is critical support, break below it, it'll trigger panic selling to push the index further down to 10247!!
Goldman Sachs rule the world, it don't care the government rescue package! Don't miss this precious opportunity to grow your equity!
Monday, 26 September 2011


Saturday, 10 September 2011
My watchlist 12-15 September
For myself accessment, I am noting down the entry price for a list of potential profit making stock. I do not recommend any stocks to buy...No I don't.. Buy at your own risk
AEM 0.235
ECS 1.29
ENGKAH (shall i wait it retrace to 2.94, then buy?)
GPACKET (shall i punt if it retrace to 0.72?)
GUH 1.22
GUNUNG (Close at 0.585 outside lower BB, will it technically rebounce to middle BB 0.64?)
HAPSENG 1.37
HEVEA 0.62
HUANN 0.26
INGRESS 0.865
JAKS 0.64
KFIMA 1.76
KUB 0.67
KURASIA 0.52
MAHSING (Close at 2.02, perhaps SM shake the stock price to frighten the retailer to dispose the stock on hand. This phenomenon potentially will continue for few days as SM want to make sure the supply in the market is dry out. By then, SM can easily make the share price fly high)
MAHSING-CB (I put it into my watch list)
MBSB 1.53
MITRA 0.53
MKLAND 0.32
MUDA 0.96
RUBEREX 0.69
SBCCORP 1.14
SDRED 0.71
SYSTECH (Punt again at 0.29?)
TEBRAU (Punt at 0.61?)
TGUAN 1.10
TIME 0.275
TIMECOM 0.62
TMS 0.09
TWSPLNT (Hit 3.52, will it another round of bullish?)
TWSPLNT-CA
WEIDA 1.05
XDL 0.32
YTLE 0.835
ENGKAH (shall i wait it retrace to 2.94, then buy?)
GPACKET (shall i punt if it retrace to 0.72?)
HAPSENG 1.37
HIBISCS 0.565 (Possible downtrend again)
INGRESS 0.865
KEURO 1.07 (Downtrend again)
KURASIA 0.52
LBS 0.835
LBS-WA MAHSING (Close at 2.02, perhaps SM shake the stock price to frighten the retailer to dispose the stock on hand. This phenomenon potentially will continue for few days as SM want to make sure the supply in the market is dry out. By then, SM can easily make the share price fly high)
MAHSING-CB (I put it into my watch list)
OSK 1.50
SBCCORP 1.14
SDRED 0.71
TEBRAU (Punt at 0.61?)
TGUAN 1.10
TIME 0.275
TIMECOM 0.62
TMS 0.09
TWSPLNT (Hit 3.52, will it another round of bullish?)
TWSPLNT-CA
WEIDA 1.05
XDL 0.32
YTLE 0.835
Wednesday, 7 September 2011
My watchlist 5 September
Armada
COASTAL
CSCENIC
BJCORP -RM1.07 (BB Squeeze, waiting for breakout)
CEPAT -RM1.42(Resting at 1.40 which is previous high, seem like strong resistance for it to break)
CIMBCOASTAL
CSCENIC
EFFICEN -RM0.195
EKSONSENGKAH
GPACKET -RM0.755 (Hit my entry price and close at 0.77)
GUANCHGGUH -RM1.22
INGRESS -RM0.865
KEYWEST -RM 0.11 (Last friday close at 0.125, doji form at peak,need next trading day for confirmation)
KFIMA -RM1.76 (Closed at 1.76, continue to monitor it)
MALTON
MASTEEL -RM1.10
MBSBMUDA -RM0.95
OLDTOWN -RM1.20
OSK -RM1.50
PTGTIN -RM0.305
SPB -RM3.50
SYSTECHTANCO -RM0.245
TEBRAU-RM0.64
TWSCORP- RM0.825
TWSPLNT -RM3.51
TWSPLNT-CAYTLE- RM0.83
Monday, 5 September 2011
Stocks plunge after US hiring dries up in August
NEW YORK (AP) -- A dismal jobs report caused stocks to plunge Friday.
The Dow Jones industrial average dropped 253 points, or 2.2 percent, wiping out its gain for the week. All 30 stocks in the average fell.
No jobs were added in the U.S. last month, the government said early Friday. It was the worst employment report in 11 months and renewed fears that another recession could be on the way. The yield on the 10-year Treasury note briefly fell below 2 percent and gold jumped $48 an ounce as cash flowed into investments seen as less risky than stocks.
"It's certainly ugly," said Jeff Kleintop, chief market strategist at LPL Financial.
The U.S. jobs news came out midday in Europe, dragging stock markets lower in afternoon trading. Indexes in Germany and France were already sinking on news that talks between Greece and international lenders over that country's debt crisis were breaking down. Germany's DAX closed down 3.4 percent; France's CAC-40 lost 3.6 percent.
The lack of hiring in the U.S. last month surprised investors. Economists were expecting 93,000 jobs to be added. Previously reported hiring figures for June and July were revised lower. The average work week declined and hourly earnings fell. The unemployment rate held steady at 9.1 percent. The rate has been above 9 percent in all but two months since May 2009.
Kleintop said the jobs report didn't change his view that the economy was headed for a stretch of weak economic growth, not a recession. He said the figures were likely skewed by unusual events that may have made employers reluctant to add jobs in August.
The Labor Department's report relies on data collected from surveys of households and businesses in the second week of August. That's right after Standard & Poor's removed the country's AAA credit rating and fears mounted that Europe's banking crisis could spread to the U.S. Television screens were filled with images of riots in London.
"I'm not surprised that businesses weren't doing too much hiring in that environment," Kleintop said.
The Dow Jones industrial average lost 253.31 points to close at 11,240.26. It was the biggest fall in two weeks. The Dow gained 329 points in the first three days of the week, turning the index positive for the year on Wednesday. Its two-day drop of 373 on Thursday and Friday left it down 0.4 percent for the week.
The Standard & Poor's 500 index fell 30.45, or 2.5 percent, to 1,173.97. The S&P is down 0.2 percent for the week. Both the Dow and S&P have fallen five of the past six weeks.
The Nasdaq composite fell 65.71, or 2.6 percent, to 2,480.33. The technology-heavy index eked out a gain of 0.48 point for the week.
Cash poured into Treasurys and gold, assets believed to be safer bets during a weak economy. The yield on the 10-year Treasury note fell to 2 percent, and briefly traded below that level. It was 2.14 percent shortly before the report came out. Yields fall when demand for bonds increases.
The price of gold rose 2.8 percent to $1,880. Fears that a stalling economy could reduce demand for oil and gasoline pushed benchmark crude oil down $2.48, or 2.8 percent, to $86.45.
Trading volume was thin ahead of the Labor Day weekend at 3.8 billion shares, 11 percent below the average volume for the year. Low volume can result in larger-than-usual moves in stock indexes. When fewer traders are active in the market, large buy and sell orders can move stock prices more than they would on a typical day.
The VIX, a measure of stock market volatility, rose 6.6 percent to 34. The index has fallen from a recent high of 48 on Aug. 8, when the Dow lost 634 points following a downgrade of the U.S. government's credit rating. The VIX traded below 20 for most of the year.
Bank of America Corp., the country's largest bank, sank 8 percent, or 66 cents, to $7.25 after The Wall Street Journal reported that regulators had asked it to develop emergency plans in case the bank's condition worsens. Bank of America is down 45 percent this year, largely on concerns about legal costs related to shoddy mortgage investments that it sold.
Other big banks dropped on separate reports that the government is preparing to sue some of them, also over mortgage investments they sold that lost value when the housing market collapsed. The Federal Housing Finance Agency, the regulator of Fannie Mae and Freddie Mac, announced the lawsuit against 17 banks after the market closed.
The FHFA says the banks lied about the quality of loans that they pooled and sold as securities. Morgan Stanley fell 97 cents, or 5.7 percent, to $15.96. Citigroup Inc. lost $1.60, or 5.3 percent, to $28.40 and Goldman Sachs Group Inc. fell $5.10, or 4.6 percent, to $107.06.
Peter Tchir, a former trader who now runs the hedge fund TF Market Advisors, said stocks will likely be dragged down in the coming weeks by high unemployment, weak spending and a possible default by Greece, which he sees as increasingly likely.
"I expect that the S&P will go back below 1,100 sometime in September," he said. "Whether we hit a recession or a contraction or not, it'll remain weak, and Europe is going to hit a wall where the banks are going to have to take losses." That would also hurt U.S. banks, he said.
Netflix Inc. plunged 9 percent, or $20.16, to $213.11 after talks collapsed with a key provider of movies and TV shows. Starz Entertainment said late Thursday that it won't renew a contract that allows Netflix to stream recently released movies and shows.
Will KLCI technically rebounce?

Stay sideline better than jump in blindly.
Tuesday, 23 August 2011
SBC CORPORATION BERHAD
| Company Name | : | SBC CORPORATION BERHAD |
| Stock Name | : | SBCCORP |
| Date Announced | : | 09/08/2011 |
| Type | : | Announcement | |
| Subject | : |
| |
| Description | : |
| |
 | |
| |
| |||
Monday, 22 August 2011
Mah Sing gets sales, bookings of RM190.6m
Property developer Mah Sing Bhd has recorded sales and bookings worth RM190.6 million with the launch of a commercial project and previews of two residential projects over the weekend.
In a statement today, Mah Sing Group Managing Director/Chief Executive Officer Tan Sri Leong Hoy Kum said all 78 units of retail lots in Star Avenue@Damansara, Sungai Buloh, valued at RM71.7 million had been snapped up.
The company also recorded a strong take up of close to 75 per cent of the Kinrara Residence luxury bungalows and semi-detached homes in Puchong. - Bernama
Sunday, 21 August 2011
SBCCORP bullish

Trend: Form higher low, uptrend (Bullish)
ADX: Bullish crossover bearish with momentum (Bulish)
MACD: Bull nearly kissing bear form below (Undetermine)
RSI: Cross above 30% from below indicating buy strength is back (Bullish)
STO: Touching 50% (Bullish)
Volume distribution: Strong buying force (Bullish)
Conclusion: 5 Bulls 1 Neutral

TP: 1.13, should we wait till 1.50?
Cut loss: 0.98
KLCI finding support at 1473

Friday, 12 August 2011
AirAsia in UK tie-up talks
“Closing off a new potential joint venture to submit to the board for AirAsia,” he wrote on his personal Twitter site. “Sales are kick ass,” said Fernandes, adding that he was en route to the U.K.
The Sepang, Malaysia-based airline flies to London through its long-haul arm AirAsia X Sdn Bhd. -- Bloomberg
Read more: AirAsia in UK tie-up talks http://www.btimes.com.my/Current_News/BTIMES/articles/20110812121453/Article/index_html#ixzz1UpV2eX3X
Wednesday, 10 August 2011
KLCI Plunge again?

Stock to punt
Wow, Dow plunge 3% -450 at 11:10pm. Perhaps, tomorrow KLCI will gap down open. Good chance to punt again? Forth round Mega sales? My watch list for tomorrow:
Mahsing- Hope drop below 2.14, then shall i consider Mahsing-cb @ 0.175?
MBSB- Punt MBSB-CA (@0.08?) if mummy below 1.50
MRCB- if below 2, punt MRCB-CE@ 0.07?
*Good luck to me*
NEW YORK (Reuters) - Wall Street stocks fell sharply on Wednesday on fears over possible trouble in the French banking sector that has large exposure to shaky peripheral European debt.
U.S. financial stocks led the decline as the KBW bank index slid 6.2 percent. Large financial institutions fell sharply, with Bank of America Corp down 12.2 percent to $6.93.
French banks were hit hard in Paris trading. Societe General, where U.S. traders have focused their attention, fell 16 percent. BNP Paribas fell 13.2 percent.
"France owns $350 billion worth of Italy's debt on their banks' books," Dave Rovelli managing director of U.S. equity trading at Canaccord Adams, who said fears of a failure in the sector were hitting U.S. markets.
The Dow Jones industrial average dropped 342.96 points, or 3.05 percent, to 10,896.81. The Standard & Poor's 500 Index fell 33.66 points, or 2.87 percent, to 1,138.87. The Nasdaq Composite Index shed 72.56 points, or 2.92 percent, to 2,409.96.
Indexes gave up much of Tuesday's snap-back rally. The S&P 500 is down nearly 18 percent since a peak at the start of May. Worries about the U.S. economy and high levels of public debt in Europe have sent stock cascading over the last two weeks.
(Reporting by Edward Krudy; editing by Jeffrey Benkoe)
Mahsing- Hope drop below 2.14, then shall i consider Mahsing-cb @ 0.175?
MBSB- Punt MBSB-CA (@0.08?) if mummy below 1.50
MRCB- if below 2, punt MRCB-CE@ 0.07?
*Good luck to me*
Wall Street slumps on worries over French banks
By Edward KrudyNEW YORK (Reuters) - Wall Street stocks fell sharply on Wednesday on fears over possible trouble in the French banking sector that has large exposure to shaky peripheral European debt.
U.S. financial stocks led the decline as the KBW bank index slid 6.2 percent. Large financial institutions fell sharply, with Bank of America Corp down 12.2 percent to $6.93.
French banks were hit hard in Paris trading. Societe General, where U.S. traders have focused their attention, fell 16 percent. BNP Paribas fell 13.2 percent.
"France owns $350 billion worth of Italy's debt on their banks' books," Dave Rovelli managing director of U.S. equity trading at Canaccord Adams, who said fears of a failure in the sector were hitting U.S. markets.
The Dow Jones industrial average dropped 342.96 points, or 3.05 percent, to 10,896.81. The Standard & Poor's 500 Index fell 33.66 points, or 2.87 percent, to 1,138.87. The Nasdaq Composite Index shed 72.56 points, or 2.92 percent, to 2,409.96.
Indexes gave up much of Tuesday's snap-back rally. The S&P 500 is down nearly 18 percent since a peak at the start of May. Worries about the U.S. economy and high levels of public debt in Europe have sent stock cascading over the last two weeks.
(Reporting by Edward Krudy; editing by Jeffrey Benkoe)
Tuesday, 9 August 2011
FBMKLCI

Altera Corp

CandleStick: Inverted hammer indicate that the stock will go sideway or go up (bullish)
ADX: Downtrend with strong momentum (Bearish)
MACD: Downtrend (Bearish)
RSI: Below 30% (Bearish)
STO: Below 20% (Bearish)
Conclusion: 1 Bull 5 Bears
What price to sell?
Blue lines are resistance level and red lines are support level. $36 is strong resistance for ALTR Corp, if break above $36, the next resistance level is $38.29. Whereas, its support at $34.33. You may either wait to sell at $36 or higher, but if the stock direction not in your favor, you may consider to sell at $34.33.
Monday, 8 August 2011
FBMKLCI

Sunday, 7 August 2011
U-TURN (Sell)
Like the UTURN
(BUY) signal in a Bear market, U-TURN (SELL) signal is equally powerful to indicate a
change in trend when a stock is going strong and is making new higher prices (in a Bull
market). All of a sudden in a Bull trend the stock puts up a disappointing down day and
surprises most people. Many people think this as just a Reaction and expect the stock to
resume its continued ascending movement soon; but it does not happen most of the time
when the reversal conditions of the U-TURN (SELL) signal are met.
Here are the conditions for the U-TURN (SELL) signal with Bearish implications in a Bull
market. Please note that the signal discussed here takes place when the stock is in a uptrend
(Bull market) but the signal actually indicates that the stock is about to enter into a Bear
market or a down trend.
Key Points to remember: Current Trend- Up. Strong Open. Strong Bear Day. Increase
in Volume.
Conditions:
1. The stock has to be in a continued Up-trend.
http://www.profitfromprices.com Profit 12 From Prices
2. Today’s HIGH price (TDH) has to be highest price (TOP) for the stock in the last few
days. (If it is the highest for the last three or more weeks, we have a strong form of a
U-TURN (SELL) signal. If it is the highest for the last three to ten trading days only,
we have a weak form of U-TURN (SELL) signal. The strong form indicates a likely
trend reversal for the current major trend; and a weak form is related to just the start
of a Reaction or the end of a Correction.).
3. Today’s Open price (TDO) has to be HIGHER than Previous Day’s High price (PDH).
TDO > PDH (The more the difference between TDO and PDH, the more powerful the
signal is going to be)
4. Today’s Close price (TDC) has to be LOWER than Previous Day’s Close price
(PDC).
TDC < PDC
5. Today’s Close price (TDC) has to be LOWER than Previous Day’s Open price
(PDO).
TDC < PDO
6. Today’s Volume has to be decisively HIGHER than the normal volume of the last few
days or Previous Day’s volume. If the above conditions are fulfilled, you will mostly
see a decisive jump in stock volume today. If you don’t see a jump in the volume
today, the signal loses some of its strength.
U-TURN (Buy)
U-TURN (BUY) is one of my most favorite signals. As mentioned earlier, the (BUY) version of
U-TURN takes place when a stock is in a down-trend and is likely to enter into an up-trend. It
signals possibilities about the start of an up-trend.
Assume a stock is going down for quite some time. The following are quotes for the latest two
days:
Today 22, 27, 21, 26
Yesterday (Previous Day) 25, 26, 23, 24
Yesterday, the stock opened at 25$, touched a high of 26$ and a new recent low of 23$, and
at the end of the day it closed at 24$. Now today, when market opens, this stock opened at
22$ (a price lower than the Previous Day’s Low price of 23$) and started going down. Now
when it is trading as low as 21$, there are signs of fresh buying which pushes the price
higher. Not a big thing so far because this kind of buying could be seen several times during
any trading session. However, when the stock manages to trade higher than today’s Open
price or 22$, we need to be vigilant for a likely trend reversal. Now if the stock keeps going up
and closes for today at say 26$, which is higher than both Previous Day’s Open price of 25$
and the Previous Day’s Close price of 24$, we have a trend reversal signal! The stock that
has been going down for the last few days and also during the first few hours today,
somehow closed with a happy ending and a strong Close price. This reflects a 180-degree
change in the sentiment. Hence we will call this signal a U-TURN (Buy) signal.
What makes U TURN a powerful Trend Reversal signal? As we know, when a stock is in a
downtrend, sellers out-number or out-power buyers. In such circumstances, it is normal for
the stock to keep making lower Low prices as time passes. This reflects bearish, negative
sentiment or outlook for this stock. Now when trading starts for today, this stock opens at a
price lower than Previous Day’s Low price. This is common for any stock that is going down
and it just indicates the continuation of the negative sentiment. Now if at some point in time
during the session, the stock stages a reversal and starts trading higher. This is likely due to
an emergence of fresh demand at current low price of the stock. Now how can we determine
that the stock is really staging a reversal? To answer this question, the following tests can
help us differentiate a strong reversal from a temporary emergence of buying. First, there has
to be a noticeable increase in volume since this turning point. Second, it has to keep going up
and cross Previous Day’s Open and also the Close price. If both these conditions are fulfilled,
we can be sure that the buying in the stock has been real and powerful. To take advantage of
the currently low stock price, some players seem to have started buying it decisively despite
the strong negative sentiment held by most other players. This buying must be significant
because it not only absorbed what most players had to sell/offer, but buyers kept asking for
more stocks even at higher prices. Today’s demand not only absorbed the selling pressure,
but it even pushed the price higher than the prices of the Previous Day! Isn’t this a
convincing reversal in stock prices?
http://www.profitfromprices.com Profit 8 From Prices
This is a complete U-TURN in the stock price trend and now with a Stop-loss at Today’s Low
price, one can start taking long positions.
Key Points to remember: Current Trend- Down. Weak Open. Strong Bull Day.
Increase in Volume.
Conditions:
1. The stock has to be in a continued downtrend.
2. Today’s Low price (TDL) has to be the LOWEST price for the stock over the last few
days. (If it is the lowest for the last few weeks, we are likely to have a strong major
trend reversal signal- a strong form of U-TURN. However if Previous Day’s Low price
is the lowest for only the last three to ten days, we have a signal that is more likely to
mark the beginning of a Correction or the end of a Reaction – a weak form of UTURN).
3. WEAK OPEN: Today’s Open price (TDO) has to be LOWER than Previous Day’s
Low price (PDL).
TDO < PDL (The more the difference between TDO and PDL, the more powerful the
signal is going to be)
4. Today’s Close price (TDC) has to be HIGHER than Previous Day’s Close price
(PDC).
TDC > PDC
5. Today’s Close price (TDC) has to be HIGHER than Previous Day’s Open price
(PDO).
TDC > PDO
6. Today’s Volume has to be decisively HIGHER than the normal volume over the last
few days or Previous Day’s volume. If you don’t see a jump in the volume today, the
signal loses some of its strength.
Friday, 5 August 2011

Thursday, 4 August 2011
XOX will continue bull?

ADX: Bull crossover bear with strong momentum (Bull)
MACD: Uptrend (bull)
RSI: Cross above 50% from below (Bull)
STO: Bull crossover bear with signal line above 80% (bull)
Volume distribution: Strong buy force(Bull)
Conclusion: 6 bulls

TP: 0.435
Cut loss: 0.35
Wednesday, 3 August 2011
Mahsing

ADX: Downtrend (Bearish)
MACD: Bullish crossover bearish (Bullish)
RSI: Moving upward (bullish)
STO: Uptrend (bullish)
Volume distribution: Strong sell force (bearish)
Conclusion: 3 Bull 2 bear 1 neutral

TP: 2.55, 2.63, 2.68
Cut Loss: 2.4
LIONIND

ADX: Uptrend with weak momentum (bearish)
MACD: Waiting bullish to crossover bearish (Neutral)
RSI: Moving upward (Bullish)
STO: Uptrend with signal line touching 80% (Bullish)
Volume distribution: Strong buy force (Bullish)
Conclusion: 3 Bull 1 bear 2 neutral

TP: 1.89, 1.95
Cut loss: 1.72
KBB

ADX: Flat (Neutral)
MACD: Downtrend (Bearish)
RSI: Below 50% (Bearish)
STO: Uptrend (Bullish)
Volume Distribution: Sell force dominant (Bearish)
Conclusion: 1 bull 4 bear 1 neutral

TP: 0.51
Cut Loss: 0.43
*Low reward to risk.
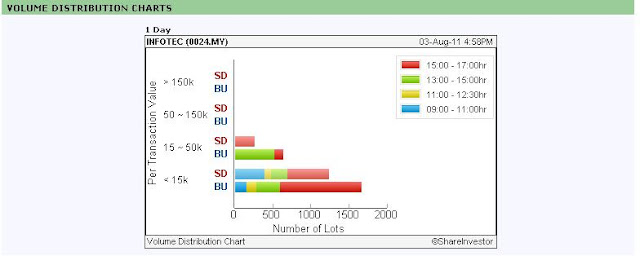
Infotec
Trend: Uptrend (Bullish)
ADX: Uptrend with momentum (Bullish)
MACD: Uptrend (Bullish)
RSI: Cross above 70% (Bullish)
STO: Uptrend with signal line above 80% (Bullish)
Volume Distribution: Strong buy force (Bullish)
Conclusion: 6 Bull

Entry price: 0.28
TP: 0.30
Cut loss: 0.26
RR: 1
ADX: Uptrend with momentum (Bullish)
MACD: Uptrend (Bullish)
RSI: Cross above 70% (Bullish)
STO: Uptrend with signal line above 80% (Bullish)
Volume Distribution: Strong buy force (Bullish)
Conclusion: 6 Bull


Entry price: 0.28
TP: 0.30
Cut loss: 0.26
RR: 1
Monday, 1 August 2011


Sunday, 31 July 2011
PCHEM my waterfall watch list
PCHEM rebounce from support 6.82 and close at 6.85. 6.82 is a strong support. It formed inverted hammer on 29 July, could be sideway or up (require next trading day to confirm). RSI level is low 17.7. Please closely monitor this stock. Entry price: 6.97. TP: 7.06, 7.20.
I will monitor PCHEM-CE as well. It is oversell recently as mother share price dive.
Exerciseprice: 6.8
ratio: 8:1
Ex-date:20/3/2012
Current PCHEM-CE price 0.09. Do collect more at cheaper price as mother share having high potential to rebounce from technical analysis perspective:)

I will monitor PCHEM-CE as well. It is oversell recently as mother share price dive.
Exerciseprice: 6.8
ratio: 8:1
Ex-date:20/3/2012
Current PCHEM-CE price 0.09. Do collect more at cheaper price as mother share having high potential to rebounce from technical analysis perspective:)

MHB waterfall
RSI below 30, indicate oversell. MACD 4R1G, could it be signal of rebounce? Volume distribution show high buy force. Entry price:7.80, TP: 8.0, 8.15
MHB-CE: I prefer collect it rather than mother share :)
Exercise price: 5.8
Convert ratio: 10:1
Ex-date: 10/2/2012
Fair price: (7.65-5.8)/10= 0.185
If mother share rebounce,do collect more on the call warrant.


MHB-CE: I prefer collect it rather than mother share :)
Exercise price: 5.8
Convert ratio: 10:1
Ex-date: 10/2/2012
Fair price: (7.65-5.8)/10= 0.185
If mother share rebounce,do collect more on the call warrant.


Friday, 22 July 2011
AirAsia-ANA tie-up Finally
Airasia next resistance at 3.85 and support 3.67. Candlestick form hanging man, potential sideway (fluctuate 3.67-3.85) next week. Take profit accordingly if hit 3.83.


Wednesday, 20 July 2011
Stock to watch 21 July: Uemland
4:25pm Airasia: It break resistance 3.67. Buy more.
11:14am WCT: It start moving, at 3.09. Support at 3.07, resistance 3.13.Worth to watch.
10:13am ASUPREM: It start moving, at 0.22. Support at 0.205, resistance 0.225. Fishing at 0.21
Uemland: Bottom fishing at support 2.47. RSI 11%, oversold.
11:14am WCT: It start moving, at 3.09. Support at 3.07, resistance 3.13.Worth to watch.
10:13am ASUPREM: It start moving, at 0.22. Support at 0.205, resistance 0.225. Fishing at 0.21
Uemland: Bottom fishing at support 2.47. RSI 11%, oversold.
Uemland-CE: Issued at 0.50 and expire at 20 Jan 2012. Exercise price at 2.55 and ratio 4:1. It is toilet paper now, haha... it still have half year to expire, want take risk to buy?
X
X
Trading Strategy
This is good trading strategy found in youtube. It is very useful in maximizing profit in uptrend, downtrend and sideway market. Enjoy!
X
Tuesday, 19 July 2011
MRCB poised for re-rating: HwangDBS
Malaysian Resources Corp Bhd (MRCB) is poised for a re-rating with more sustainable earnings delivery and visible share price catalysts.
HwangDBS Vickers Research, in a note today, said with the coming general election, it was also an ideal proxy, as a government-linked company contractor and developer.
"Our RM700 million to RM800 million per annum new order assumptions for financial years 2011 to 2012 seem conservative, given MRCB's healthy pipeline of jobs.
"We expect MRCB to capitalise on its role as project delivery partner for the River of Life project, with phase one, worth RM3.3 billion with some visibility on contract awards by year-end," it said.
Mitrajaya up on freshwater lab job
KUALA LUMPUR: MITRAJAYA HOLDINGS BHD [] shares advanced in early trade on Wednesday, July 20 after it secured a RM13.51 million contract to build a freshwater laboratory complex at Tasik Chini in Pekan, Pahang.
At 9.05am, Mitrajaya added two sen to 60.5 sen with 437,900 shares traded.
Its unit Pembinaan Mitrajaya Sdn Bhd accepted the letter of acceptance of contract from the East Coast Economic Region Development Council to build phase one of the laboratory.
At 9.05am, Mitrajaya added two sen to 60.5 sen with 437,900 shares traded.
Its unit Pembinaan Mitrajaya Sdn Bhd accepted the letter of acceptance of contract from the East Coast Economic Region Development Council to build phase one of the laboratory.
Asia market rise as global market rebounce
WELLINGTON: Asian stocks are set for healthy gains on Wednesday, as easing debt fears, solid data, and earnings above expectations helped global markets gain.
The main Wall Street indices turned in a strong performance with the Dow and S&P 500 both gaining 1.6 percent while the Nasdaq rose 2.2 percent.
The latter's gains were made in part on anticipation of Apple's results due after the bell.
The maker of iPhones and iPads reported quarterly revenue well above analysts' estimates, adding to reports from International Business Machines Corp and Coca-Cola
The market got a boost late from comments by President Barack Obama that progress was being made towards a debt reduction deal.
Adding to the positive mood housing starts hit a six-month high in June, sending the PHLX Housing Index up 3 percent.
Asian stocks listed on Wall Street rose 1.2 percent while world stocks, as measured by the MSCI world equity index, gained 1.38 percent.
British shares added 0.7 percent while European shares were up 0.8 percent as the beaten-down banks regained some ground on easing debt worries and commodity stocks rose on higher prices.
The euro pushed higher against the U.S. dollar as investors cast an eye to a euro zone summit later this week, where it's hoped leaders will approve a second bailout for Greece worth 110 billion euros.
Japanese markets, which fell below its 200 day moving average support level on Tuesday, are set for a firm open with Nikkei futures traded in Chicago 120 points above the last closing level in Osaka.
Australian stocks are also set to gain helped by strong gold and metals prices, with share price index futures up 1.1 percent to be 21.85 points above the close of the underlying S&P/ASX 200 index. – Reuters
Will Mitra rebounce ?
From candlestick, Mitra form Piercing Line. It is reversal signal. The reliability is low because the gap down occurs below support (0.58). however, it is worth to monitor tomorrow. To be uptrend, it need to support by high volume.
Entry price: Close above 0.60
take profit: 0.62, 0.64,0.67
cut loss:0.58


Entry price: Close above 0.60
take profit: 0.62, 0.64,0.67
cut loss:0.58


Stock to sell 20 July: Airasia
I always believe this trading rule: Buy on rumor sell on news. Take profit at 3.58

OSK Upgrades Fair Value Of Airasia To RM4.34
KUALA LUMPUR, July 19 (Bernama) -- OSK Research Sdn Bhd has upgraded its fair value on AirAsia Bhd to RM4.34 from RM3.89 while maintaining its 'buy' call.In a research note Tuesday, OSK said AirAsia's revenue passenger kilometres (RPK) and passenger carriage for first half of financial year 2011 (1HFY11) remained consistently strong, growing by 16 per cent and 23.2 per cent year-to-date.
"Considering that 1H is typically the weaker half of the year, AirAsia's numbers nevertheless remained consistently strong despite the fuel surcharge having taking full effect in May," it said.
It said AirAsia's second quarter earnings were expected to rise further quarter-on-quarter on the back of improving yields due to the fuel surcharge, loan factor and RPK.
-- BERNAMA
Monday, 18 July 2011
KLCI dive down

Share prices on bursa Malaysia closed lower at market close today as the FBMKLCI bore the brunt of investor pessimism and external headwinds.
At 5pm, the FBM KLCI was down 14.67 points to 1,562.58, with 159 gainers, 646 losers and 268 counters traded unchanged. Turnover was 753.77 million shares valued at RM1.383bil.
In the region, all benchmark indices were lower at market close. Hong Kong's Hang Seng Index lost 70.63 points to 21,804.75, Shanghai's Composite Index 3.48 points to 2,816.69, Seoul's Kospi Index 14.72 points to 2,130.48, and Singapore's Straits Times Index 5.29 points to 3,078.95.
The red lines in the chart below is the support for KLCI whereas blue line is the resistance. The KLCI is under correction after a series of bullish.

Will Airasia continue uptrend?
Its load factor rose to 80 per cent in June from 79 per cent last year, it said. In Malaysia, passenger trafic climbed 11.1 percent, 33.4 per cent in Thailand and 39.6 per cent in Indonesia, it said. The group carried 20.9 per cent more passengers in the second quarter of 2011, according to the statement. -- Bloomberg
Read more: AirAsia flies 19.6pc more passengers in June http://www.btimes.com.my/Current_News/BTIMES/articles/20110718154343/Article/index_html#ixzz1STC1fx4E
All Bank Sector down and they are waiting for the Debt Ceiling at USA,could this factor dragging Airasia to continue uptrend? Today, ADX, MACD, RSI, STO signal showing bearish :(
Airasia form a lower high but its closing price still above 20dMA, worth to hold for another round of bullish.

MRCB most likely sideway trading
From the indicators, MRCB most likely will in sideway trading mode this week, the price ranging from 2.22-2.28. The 20dMA (brown line) is a strong support for MRCB. As long as it doesn't close below 20dMA, it still have potential to become uptrend.


Sunday, 17 July 2011
NASDAQ- Altera Corp rebounce from support?

Support : $41.5, $39.73
Resistance: $44.42, $45.75, $48.42

TRC sideway again?
Inverted hammer formed last friday most likely will lead the TRC to continue sideway next week, price fluctuating around 0.68-0.755.
Entry price: 0.76
Take profit: 0.815, 0.855
Cut loss: 0.71


Entry price: 0.76
Take profit: 0.815, 0.855
Cut loss: 0.71


Saturday, 16 July 2011
Analyze on XDL Fundamental performance


How investor pick stock base on PE?
For instance, stock A and stock B are in the same business field, both financial fundamental look similar, stock A trade at PE=10 whereas stock B trade at PE=15. Obviously, investor preferable to pick stock A as it is consider relatively cheap.
How we can determine a company is well managed?
For a well managed company, its annual ROE is ~25% and ROA is ~15%. In this case, XDL annual ROE=34.03% and ROA= 24.37%.
Annual ROE=Annual profit / (Asset-Liabilities) ;
Annual ROA= Annual profit/ Asset;
How we know a company is holding enough cash?
A strong fundamental company current ratio should be less than 5. In this case, XDL current ratio is ~1 and it is consider good.
How earning per share(EPS) affect the stock price?
PE=Current stock price/ EPS;
Assume the XDL PE is trade at 1.765. Year 2010 EPS=0.1983.
Current stock price= 1.765 x 0.1983 = 0.35.
If Year 2011 projected EPS is 0.25, stock fair price= 0.44.
2011 Q1 EPS=0.0431, XDL need to work hard in Q2,Q3,Q4 to gain 0.2069 to make annual EPS=0.25.
Would XDL archive it?
Please leave some comment if you have any insider news about XDL or anything about XDL.
Friday, 15 July 2011
WCT rebounce from support 3.08 (Stock to watch on 18 July)
Entry price: RM3.17
ADX: Bullish momentum weak
MACD: 4R1G, bull almost kissing with bear from below (Bullish)
RSI and STO start to rebounce, bullish.

ADX: Bullish momentum weak
MACD: 4R1G, bull almost kissing with bear from below (Bullish)
RSI and STO start to rebounce, bullish.

Kurasia hit our take profit price
Kurasia high 0.57. Our take profit price at RM0.56
Sold off half at 0.56 to secure the profit. Next take profit price at 0.58 and 0.60. New cut loss at 0.50. If you would like to maximize the profit from this counter, you may use Trail Stop Loss Method

Sold off half at 0.56 to secure the profit. Next take profit price at 0.58 and 0.60. New cut loss at 0.50. If you would like to maximize the profit from this counter, you may use Trail Stop Loss Method

AirAsia-ANA tie-up likely
How you can make huge profit in Airasia? Maximize profit using trail stop loss technique
PETALING JAYA: AirAsia is likely to have a joint venture with Japan's largest carrier - All Nippon Airways (ANA) - to set up a low cost airline likely to be called AirAsia Japan.
An announcement on the collaboration is expected to be made next week and it would involve the setting up of a low cost carrier (LCC) and a hub in Japan by AirAsia. The LCC will serve the domestic market and eventually regional markets, sources say.
Like its other joint ventures in Indonesia, Thailand, the Philippines and Vietnam, AirAsia will partner ANA, which may lead in equity share holding but operationally, the Malaysian carrier will be in the driver's seat.
Whether this JV will involve ANA's recently launched low cost unit, Peach Aviation, is not clear.
 Peach, which is said to have received its Air Operators' Certificate from the country's Civil Aviation Bureau is owned by ANA in partnership with Hong Kong's First Eastern Investment Group and Japan's Innovative Network. All three parties own a 33.3% each in Peach.
Peach is supposed to operate in March next year from Kansai International Airport and AirAsia Japan probably will operate from either Tokyo or even Fukukoa.
There are plenty of choices for AirAsia to operate from including Fukukoa Osaka, Sapporo, Haneda and even Kansai.
Narita Airport, based in Tokyo, is the busiest airport in Japan and last year it said it would open a terminal exclusively for low-cost airlines in a bid to grab a larger slice of the increasingly competitive Asian tourism market.
For AirAsia which is still in expansion mode, the JV bodes well in terms of reach and connectivity. Even though AirAsia's sister airline, AirAsia X flies to Tokyo via Haneda, a hub gives the airline exposure to a new market, traffic and connectivity that enlarges its route network.
This venture will eventually translate to additional revenues for AirAsia in the longer term.
AirAsia joint venture in the Philippines is set to take off in October this year from Clark. Both ThaiAirAsia and IndoAirAsia have grown in size to become candidates for initial public offerings.
ANA is the eighth largest airline in the world by revenues and the largest in Japan by passenger numbers. Founded in 1952, it flies to 76 domestic and international cities in a fleet of 228 aircraft serving a network of 164 routes.
ANA has 33,000 employees and operates more than 1,000 flights a day. In 2009, it carried 44 million passengers.
ANA has been a core member of Star Alliance since 1999. It has a 47% share in Japan's domestic passenger services market.
ANA's rival is Japan Airlines (JAL) which is also in talks with Qantas to set up its own low cost airline. JAL is a member of oneworld and ANA has a code share arrangement with Malaysia Airlines.
ANA will also be launching the world's newest and most advanced passenger aircraft - the Boeing 787 Dreamliner this year.
PETALING JAYA: AirAsia is likely to have a joint venture with Japan's largest carrier - All Nippon Airways (ANA) - to set up a low cost airline likely to be called AirAsia Japan.
An announcement on the collaboration is expected to be made next week and it would involve the setting up of a low cost carrier (LCC) and a hub in Japan by AirAsia. The LCC will serve the domestic market and eventually regional markets, sources say.
Like its other joint ventures in Indonesia, Thailand, the Philippines and Vietnam, AirAsia will partner ANA, which may lead in equity share holding but operationally, the Malaysian carrier will be in the driver's seat.
Whether this JV will involve ANA's recently launched low cost unit, Peach Aviation, is not clear.

Peach is supposed to operate in March next year from Kansai International Airport and AirAsia Japan probably will operate from either Tokyo or even Fukukoa.
There are plenty of choices for AirAsia to operate from including Fukukoa Osaka, Sapporo, Haneda and even Kansai.
Narita Airport, based in Tokyo, is the busiest airport in Japan and last year it said it would open a terminal exclusively for low-cost airlines in a bid to grab a larger slice of the increasingly competitive Asian tourism market.
For AirAsia which is still in expansion mode, the JV bodes well in terms of reach and connectivity. Even though AirAsia's sister airline, AirAsia X flies to Tokyo via Haneda, a hub gives the airline exposure to a new market, traffic and connectivity that enlarges its route network.
This venture will eventually translate to additional revenues for AirAsia in the longer term.
AirAsia joint venture in the Philippines is set to take off in October this year from Clark. Both ThaiAirAsia and IndoAirAsia have grown in size to become candidates for initial public offerings.
ANA is the eighth largest airline in the world by revenues and the largest in Japan by passenger numbers. Founded in 1952, it flies to 76 domestic and international cities in a fleet of 228 aircraft serving a network of 164 routes.
ANA has 33,000 employees and operates more than 1,000 flights a day. In 2009, it carried 44 million passengers.
ANA has been a core member of Star Alliance since 1999. It has a 47% share in Japan's domestic passenger services market.
ANA's rival is Japan Airlines (JAL) which is also in talks with Qantas to set up its own low cost airline. JAL is a member of oneworld and ANA has a code share arrangement with Malaysia Airlines.
ANA will also be launching the world's newest and most advanced passenger aircraft - the Boeing 787 Dreamliner this year.
Subscribe to:
Posts (Atom)